Capture Engine statistics graphs
The graphs function on a Capture Engine lets you create customized graphs of user-defined statistics from the Nodes, Protocols, Applications, WLAN, and Summary statistics views of Capture Engine capture windows.
The Graphs tab of the Capture Engines window also allows you to create and manage graph templates, which can be used by any Capture Engine capture on that particular Capture Engine. See Capture Engine graph templates.
To view graphs in a Capture Engine capture window:
1. Start a capture from the Home tab or Capture tab of a connected Capture Engine. See Creating a Capture Engine capture window.
2. Select Enable graphs in the Graphs options of the Capture Engine Capture Options dialog. See Capture Engine graphs capture options.
3. Click . A new Capture Engine capture window appears.
4. Click and then the Graphs view of the Capture Engine capture window. See Capture Engine capture window graphs.
5. Select the graphs you wish to display in the Capture Engine capture window. The example below displays the graphs for ARP analysis and Expert events.
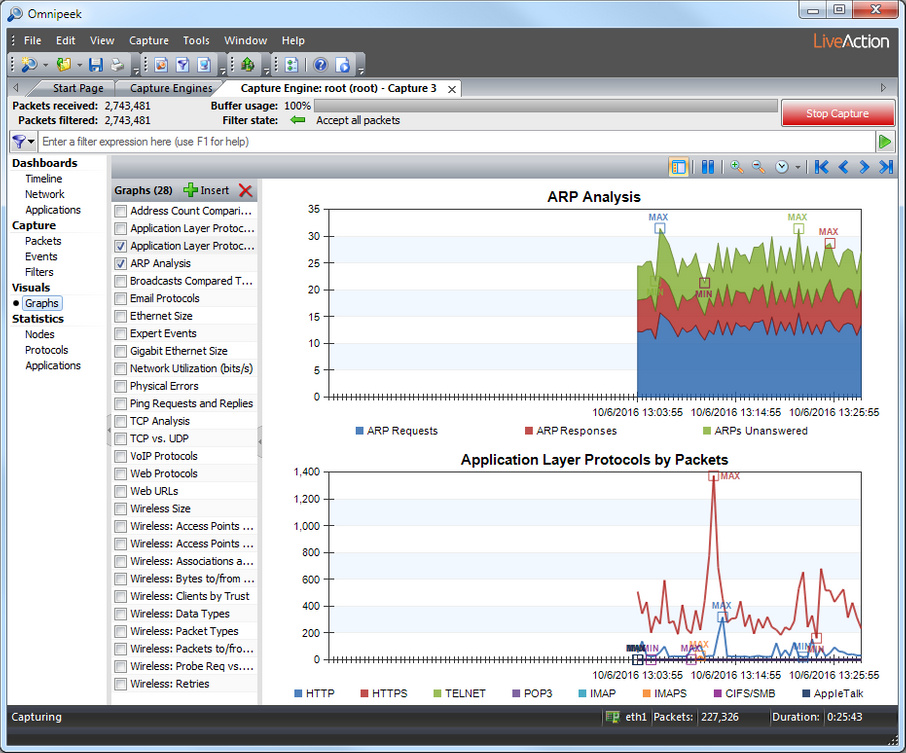
TIP: Right-click in the graph area to choose from a of graph displays.